Reports Clients Testimonials Resources Order FAQ About
In Case Study #2, we showed how awareness of a pattern of substantial downward moderation on an internal assessment led to improvement the following year in both scoring accuracy and awarded scores.
In this case study, we show a sustained association between decreasing moderation and rising scores, further demonstrating the value of visualizing and analyzing trends in moderation.
(Although the data presented are real, the name of the school and the subject have been changed.)
We begin by looking at the Moderation Summary Table for Business and Management HL at Acadamigo International School. The table presents an overall picture of how internal assessment scores for that subject at that school have been moderated by the IBO over the five year period, 2011 to 2015.
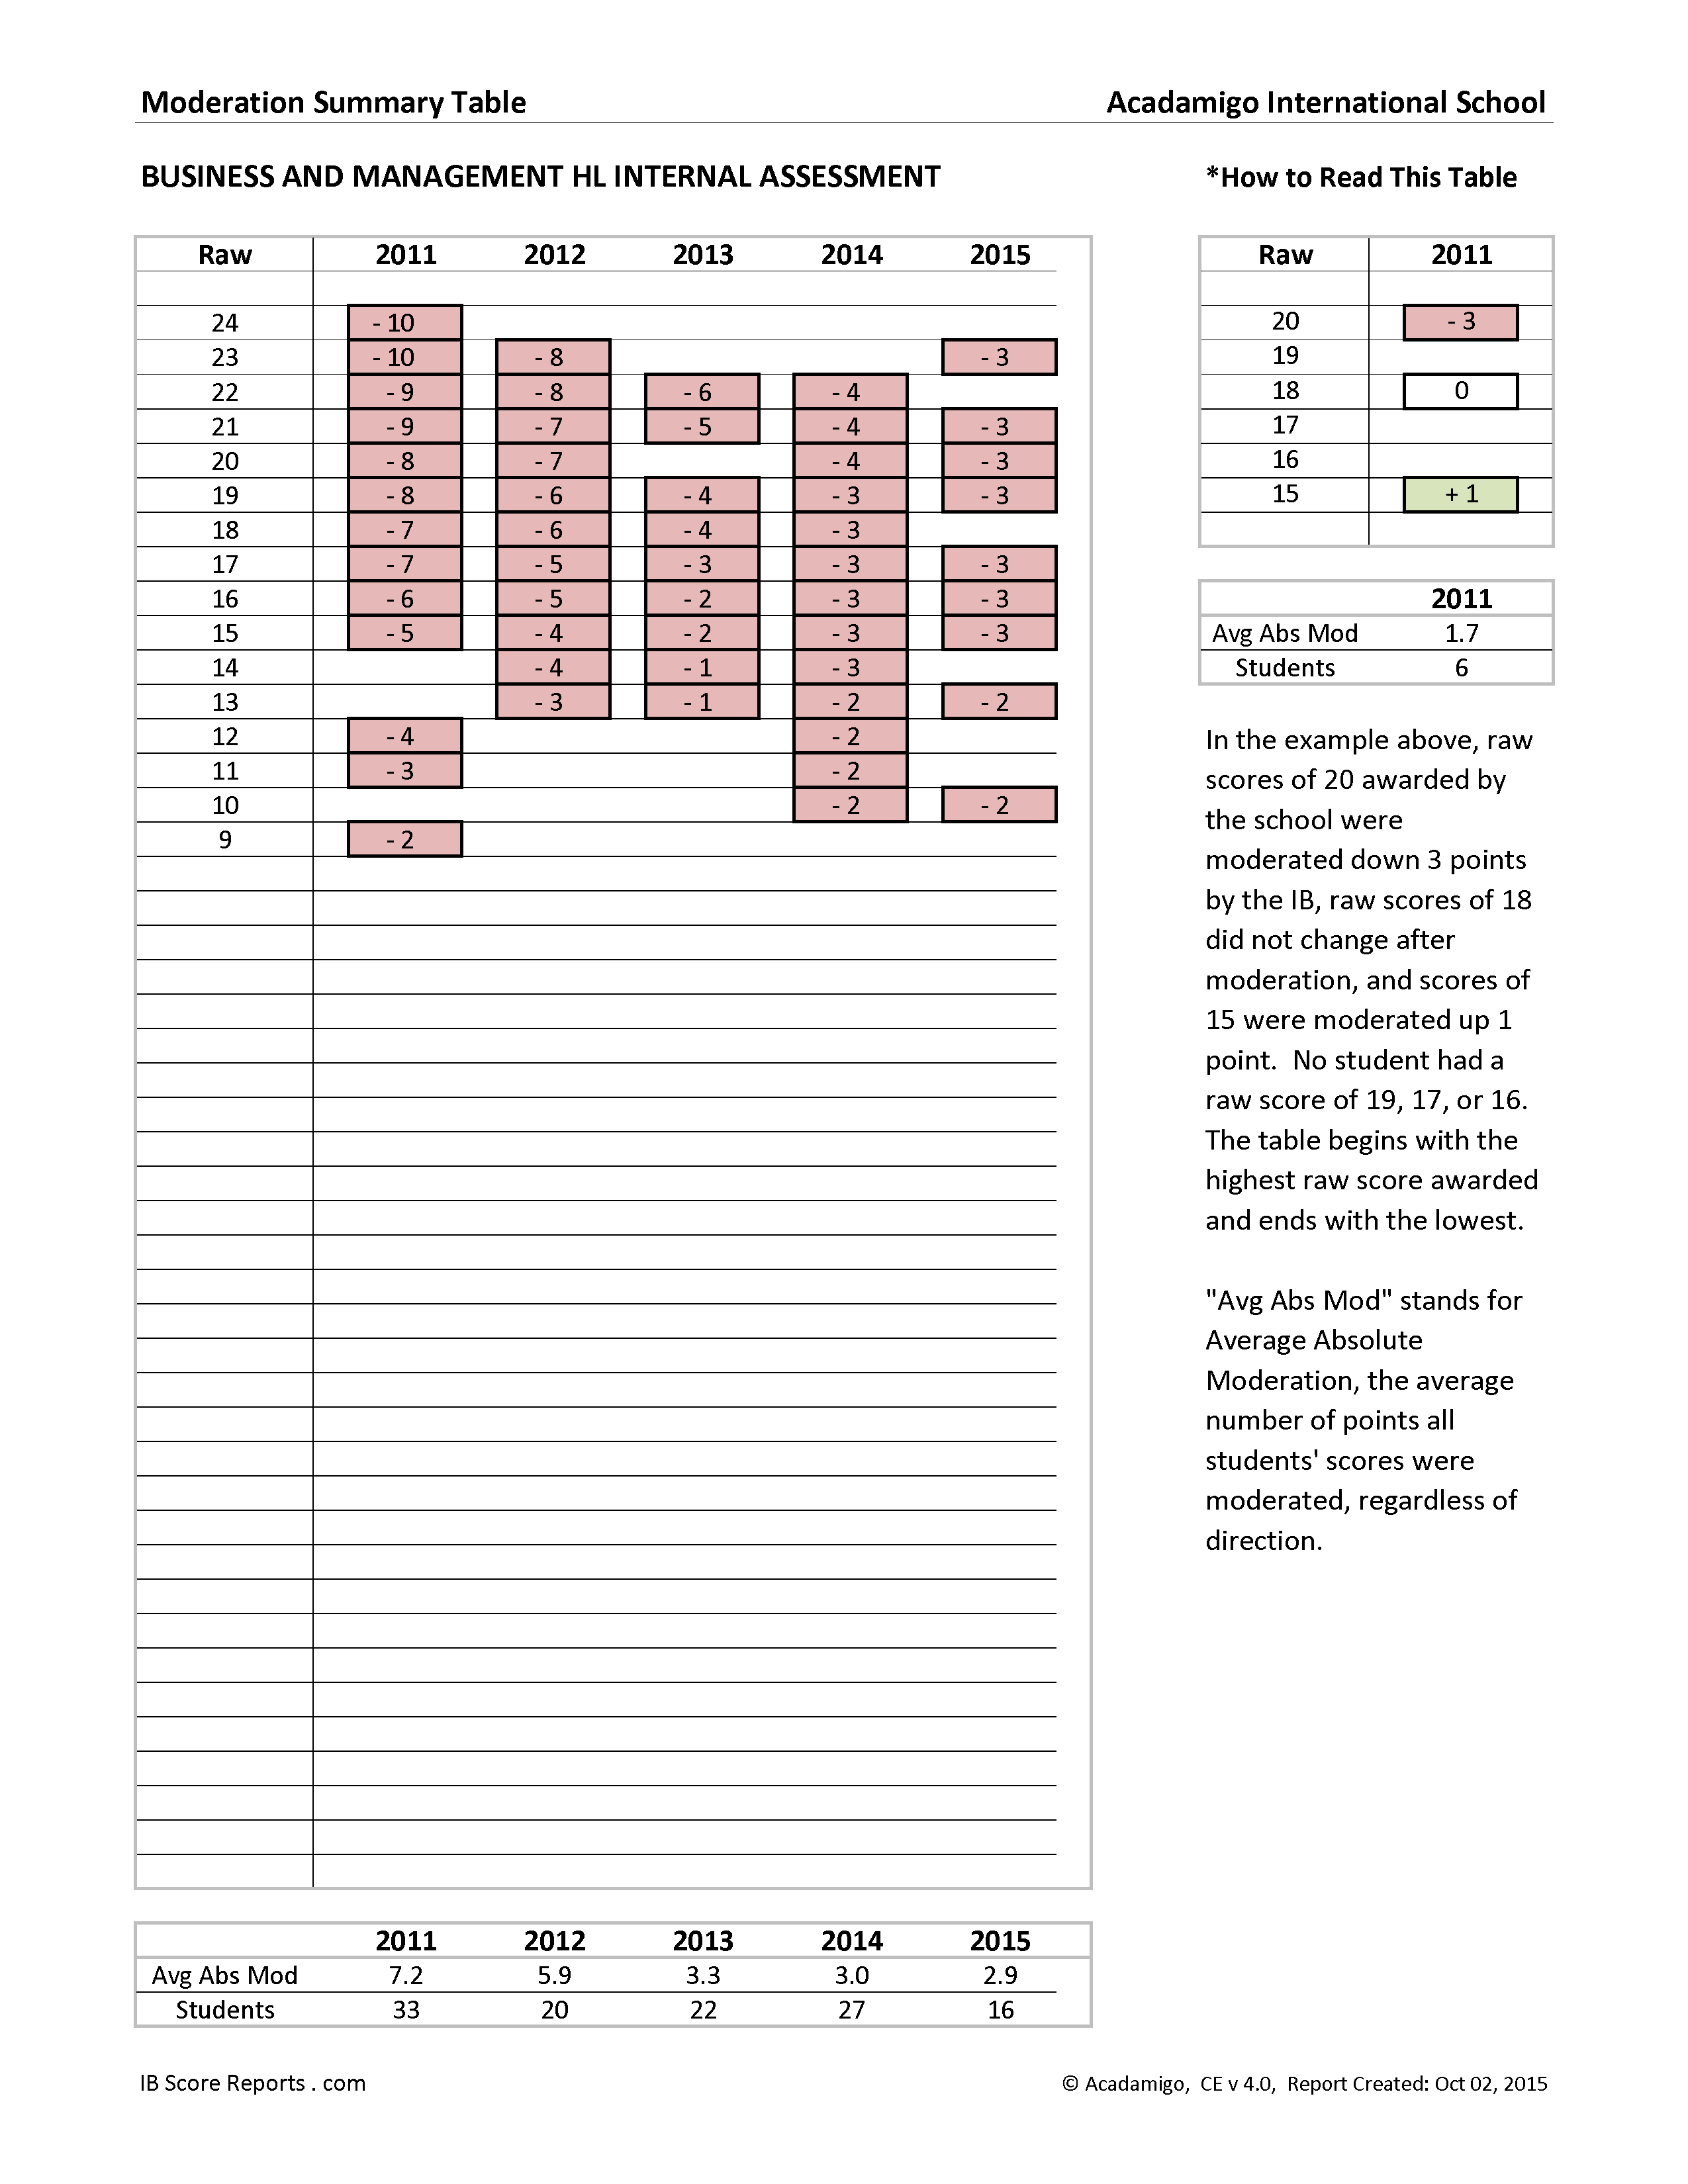
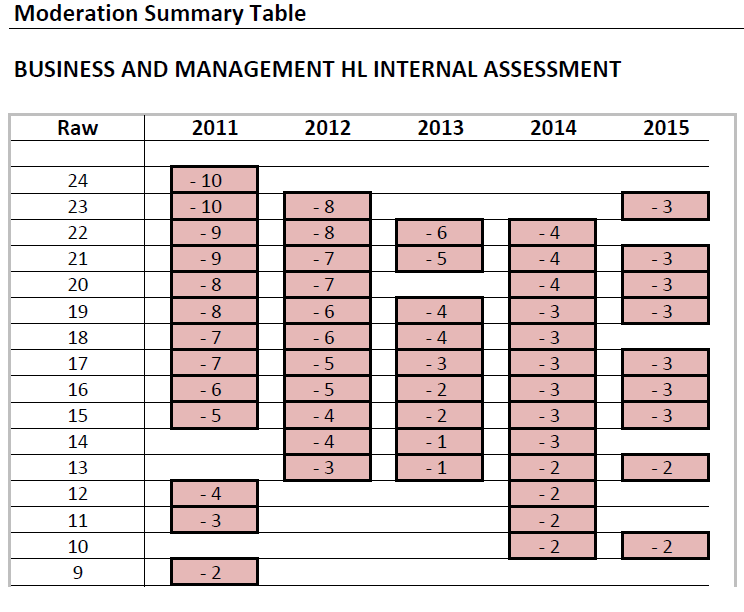
Moderation Summary Table, Business & Management HL Internal Assessment, 2011 to 2015
The scores running down the left of the table represent the range of raw scores submitted by the school from 2011 to 2015. The highest value, 24, is the highest raw score the school submitted, and the lowest value, 9, is the lowest raw score the school submitted.
In the column for each year, we can see how the IBO moderated the raw scores submitted by the school. Focusing on the upper half of the display, one can see that the magnitude of moderation has steadily decreased each year.
Decreasing Moderation of Scores, Business and Management HL Internal Assessment, 2011 to 2015
In 2011, a raw score of 23 was moderated down 10 points. In 2015, that same raw score was moderated down just 3 points.
A raw score of 21 was awarded in each of the five years. Here are the moderations applied to that score:
Moderation of the Raw Score 21
| Year | Moderation | Final Score |
| 2015 | -3 | 18 |
| 2014 | -4 | 17 |
| 2013 | -5 | 16 |
| 2012 | -7 | 14 |
| 2011 | -9 | 12 |
We see a steady decline in moderation corresponding to a steady rise in final awarded score.
If we look at the bottom of the Moderation Summary display, we find the average absolute moderation for each year.
![]()
Average Absolute Moderation of Scores, Business and Management HL Internal Assessment, 2011 to 2015
(Note: We average absolute values, so that a moderation of +2 will not cancel out a moderation of -2. Both +2 and -2 represent a scoring change of 2 points, so we average their absolute values.)
Here again we see that the average moderation steadily decreased over time:
Average Absolute Moderation (Avg Abs Mod)
| Year | Avg Abs Mod |
| 2015 | 2.9 |
| 2014 | 3.0 |
| 2013 | 3.3 |
| 2012 | 5.9 |
| 2011 | 7.2 |
This shows that the teachers were becoming more accurate in their scoring of the internal assessment.
Now let's look at the Component Display for that same internal assessment to see what happened to the average scores during those years.
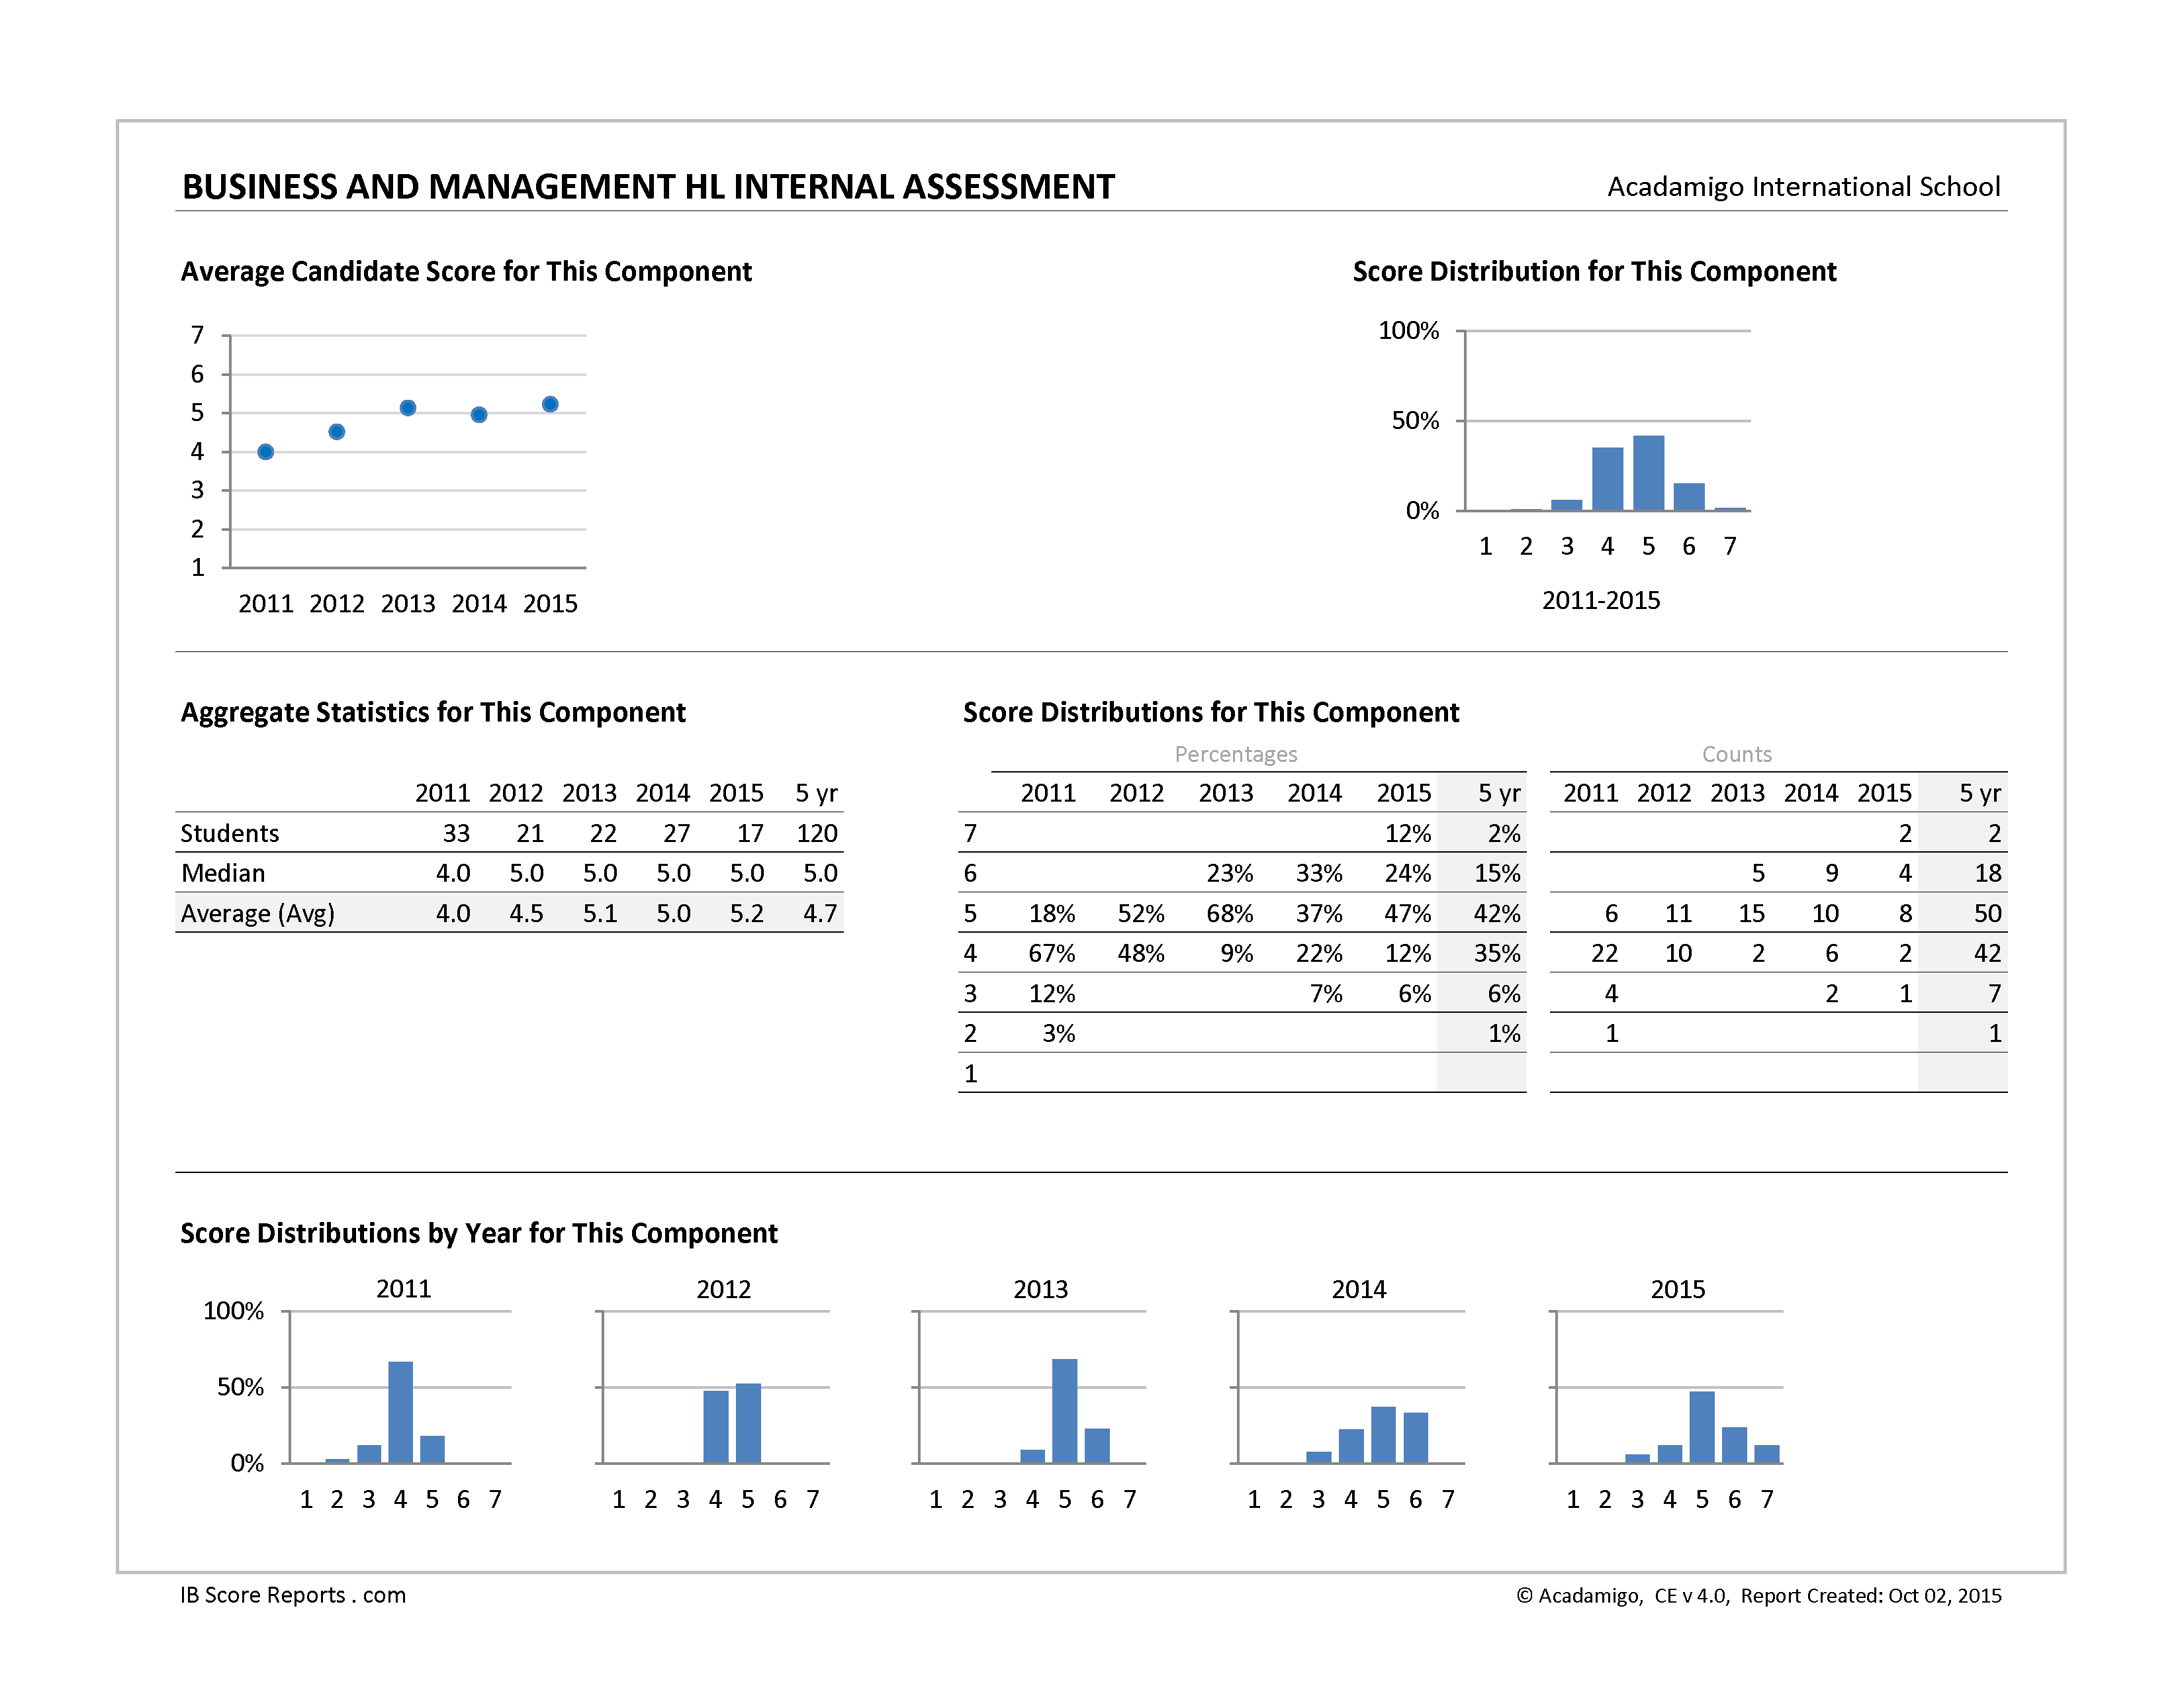
Component Score Display, Business and Management HL Internal Assessment, 2011 to 2015
Zooming in on the Average Candidate Score in particular, we see a steady climb in the average score, except for a very slight dip in 2014 of 1/10th of a point.
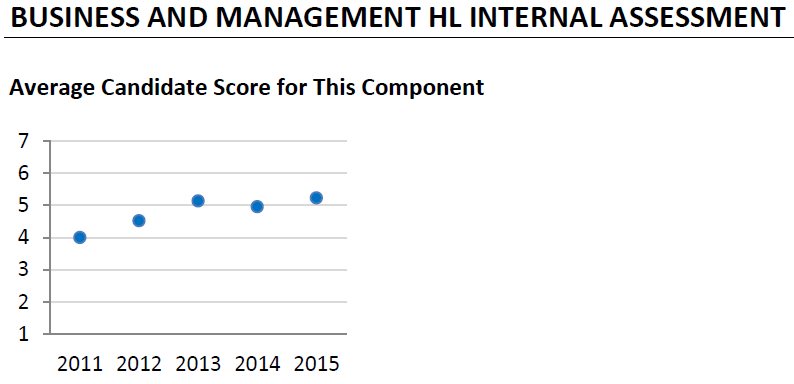
Average Score, Business and Management HL Internal Assessment, 2011 to 2015
Here are the average absolute moderations and averages scores over time:
| Year | Avg Moderation | Avgerage Score |
| 2015 | 2.9 | 5.2 |
| 2014 | 3.0 | 5.0 |
| 2013 | 3.3 | 5.1 |
| 2012 | 5.9 | 4.5 |
| 2011 | 7.2 | 4.0 |
If we plot the average absolute moderation against the average score, we see a nice linear trend.

Average Moderation vs. Average Score, Business and Management HL Internal Assessment, 2011 to 2015
2011 was the year with the highest average moderation (7.2), and was also the year with the lowest average score (4.0). 2015 was the year with the lowest moderation (2.9), and was also the year with the highest average score (5.2).
Generally speaking, as moderation decreased, scores increased. Indeed, there is a significant inverse relationship between the average absolute moderation and the average awarded score. (The correlation is -0.98 with p < 0.01.)
One might think this should be obvious: less moderation means the awarded scores stay closer to the initial teacher marks, which means they'll be higher. But that's not necessarily the case.
The highest awarded mark in 2011 was 14. (A raw score of 24 was moderated down 10 points.) If the following year the teacher had awarded no score higher than 14 and the IBO applied zero moderation, there would have been a decrease in moderation without a rise in scores.
But what we see is that the teacher continued to award high marks, which the IBO increasingly validated. In the eyes of the moderators, the teacher's scoring became more and more accurate AND the students were doing better and better work. It's the latter fact that led to a rise in scores.
Here's what happened to the highest raw score in each of the five years:
| Year | Highest Raw | Moderation | Final Score |
| 2015 | 23 | -3 | 20 |
| 2014 | 22 | -4 | 18 |
| 2013 | 22 | -6 | 16 |
| 2012 | 23 | -8 | 15 |
| 2011 | 24 | -10 | 14 |
The end result of this five-year span is that the highest awarded mark in 2015 was 20. (A raw score of 23 was moderated down just 3 points.) That's a 6 point gain on a 25 point scale!
Our goal is to help schools gain insights from their IB results to improve teaching and learning.
This case study showed a strong association between decreasing moderation and rising awarded scores on an internal assessment.
While that association does not hold in every case, it is something that we see frequently. And it makes sense. Being able to score an internal assessment accurately is evidence of a better understanding of the IBO standards and criteria in the rubric. It's reasonable to assume that those standards and criteria can then be better communicated to the students and that student learning and work can be better guided. (For more discussion on why an increase in scoring accuracy might lead to an increase in student scores, see the last portion of Case Study #2, where we sketched four possible explanations.)
While our reports cannot identify the cause of things like downward moderation, they do uncover and illuminate such trends, and thereby serve as catalysts for investigation, reflection, and productive discussions among teachers and administrators.
Getting started is easy. Just click here to send us an email: support@acadamigo.com